Our Trade-In and Upgrade Data Trends Review highlights some interesting movements in the industry during the first quarter of this year.
Generation Shift
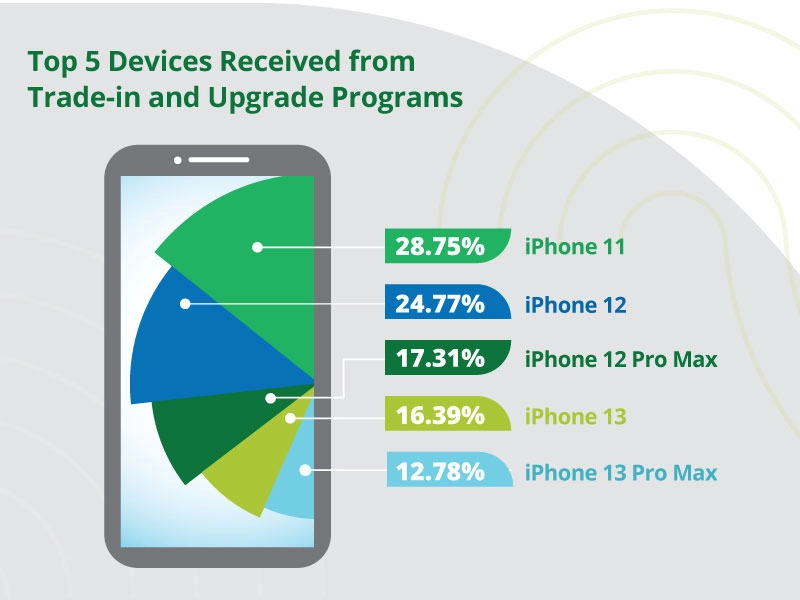
The iPhone 11 has been the top device turned in through trade-in and upgrade programs for eight straight quarters. Prior to the iPhone 11 holding the No. 1 spot, it was the iPhone XR, which held that title until 2Q22. The iPhone 12 is poised to be the No. 1 device this quarter, as the quantity difference between the 11 and 12 has been shrinking and is now separated by just 4 percentage points.
Here’s what we noticed when we examined the data.
- The iPhone XR took on the No. 1 spot of our top five turned-in-devices list during 2Q21. That device was released 4Q18, 2.5 years prior.
- The iPhone 11 took on the No. 1 spot during 2Q22. That device was released 4Q19, 2.5 years prior.
- The iPhone 12 is now positioned to take the No. 1 spot in 2Q24. That device was released 4Q20, 3.5 years ago.
Another way to look at this is the iPhone XR and 11 were both two generations behind the most current device when they moved into the No. 1 spot, whereas the 12 is growing in position and, when it takes the top positions, it’ll be three generations behind the most current shipping iPhone. When the age of the most-traded device increases, it’ll certainly impact the overall average age of devices at trade-in. We don’t see that full year reflected in the change from 2Q21 through 1Q24, but we have seen device age go from 40 months to 44 months during that same time period.
5G Supplying the Secondary Market
Though the iPhone 11 is still the top device turned in, all four of the other top five devices are 5G. This bodes well for the secondary market as 5G infrastructure continues to be built out. According to GSMA Intelligence, as of January 2024, 101 countries have launched commercial 5G services.¹ This is a 25% increase since May 2022, where 80 countries had rolled out 5G mobile services. The 5G devices have the bonus effect of being able to also operate in 4G, making them more versatile in the secondary market.
Time to Promote Trade-In for Smartwatches
It’s estimated the smartwatch market size will reach $77.22 billion globally by 2030, with a compound annual growth rate of 14.84% starting in 2023.² Not only is there a rise in the popularity of smartwatches, but we also see the price of some smartwatches rival the price of smartphones, coming in at $799. Trade-in can certainly help offset the cost of purchasing a new smartwatch. As an example, looking at even a more moderately priced smartwatch like the Apple Watch Series 9 with an MSRP of $399, trading in a Series 7 could equate to nearly a 30% discount. The big question is: Do your customers know they can receive trade-in value for their watches? Are there upgrade opportunities being missed?
For more insights, download our infographic.
See highlights from this past quarter’s report.
Trade-Ins Flat YOY
Coming off the heels of a record-breaking and busy-season fourth quarter, we saw, as would be expected, a decrease in the amount of money returned to consumers through trade-in programs. Consumers received an estimated $874M from trade-in during the first quarter. We see this as relatively flat compared to 1Q23.
According to the analyst firm Counterpoint, there was a dip YOY in Q1 on new smartphone shipments in North America.³ A slowdown in smartphone sales would have a negative impact on trade-in transactions.